
Diagnostic tests have played a crucial role during the global wave of COVID-19. The gold standard diagnostic for severe acute respiratory syndrome coronavirus 2 (SARS-CoV-2) infection continues to remain molecular assays like reverse transcriptase-polymerase chain reaction (RT-PCR) performed on nasopharyngeal (NP) swabs. Newer assays, for instance – chemiluminescent immunoassays (CLIA) and Single Molecular Arrays (Simoa), have also demonstrated a good correlation with RT-PCR on NP swabs, at least for cycle thresholds.
Despite the high sensitivity of RT-PCR, the correlation between RT-PCR results from NP swabs and disease severity has been challenged. Moreover, variability in cycle threshold (Ct) values dependent on sample procedure, as well as the likelihood of false negatives, are some of the drawbacks associated with RT-PCR results from NP swabs collected before symptom onset. As a result, there is scope for improvement in the diagnostics of SARS-CoV-2 infection. The ideal diagnostic test should be capable of detecting the viral presence with similar or higher sensitivity than RT-PCR performed on NP swabs, with a superior estimation of the prognostic value, in addition to requiring easily accessible biological specimens.
Routinely, blood samples are employed to determine the antibody concentration. Still, this technique is seldom used in cases with acute infection or due to the possibility of pre-existing circulating antibodies. Another alternative is examining the antigen in non-respiratory fluids like the bloodstream—which is backed by evidence that SARS-CoV-2 migrates from the lungs into the bloodstream.
In this perspective, a new study published on the medRxiv* preprint server analyzed the clinical efficacy of two serum antigen tests to identify SARS CoV-2 infection and evaluate the kinetics of serum nucleocapsid (N) antigen in severe and non-severe patients for disease severity prediction.
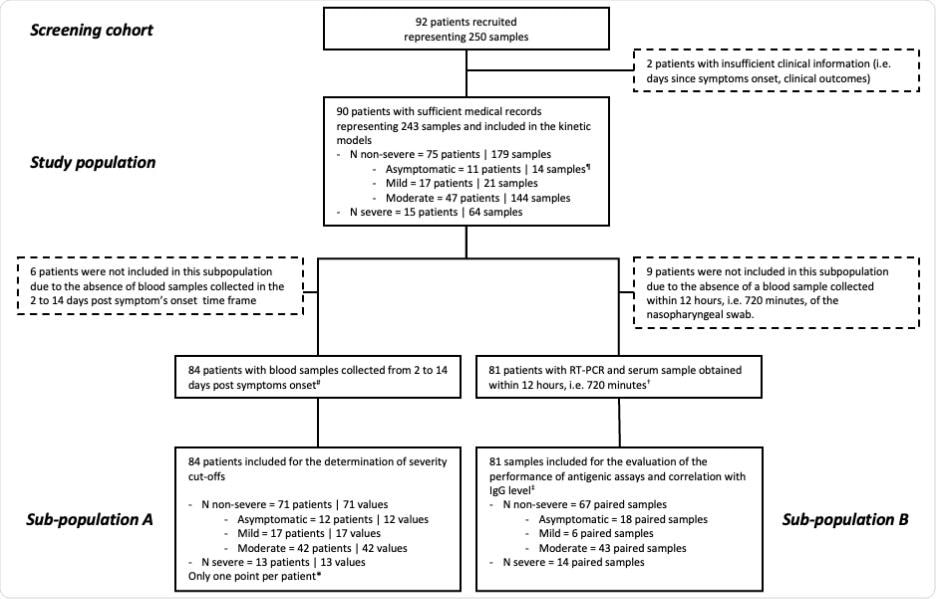
Here, the serum N antigen was evaluated using a CLIA and the Simoa, and severity thresholds were established. This study involved 90 patients and 243 blood samples collected at various times following symptom onset. The severity of the disease was assessed using the World Health Organization (WHO) clinical progression scale. The study (in compliance with the Helsinki Declaration) flow diagram has been illustrated below:
The commercial SARS-CoV-2 N-Protein Advantage kit, a paramagnetic microbead-based sandwich enzyme-linked immunosorbent assay (ELISA), was used to examine the samples. CLIA detected the SARS-CoV-2 N antigen in patient sera. RT PCR for SARS-CoV-2 detection in NP swab samples was performed targeting the N2 and E genes. The data were analyzed using descriptive statistics. All longitudinal samples from the research population were utilized to estimate the time kinetics curves using smoothing splines with four knots.
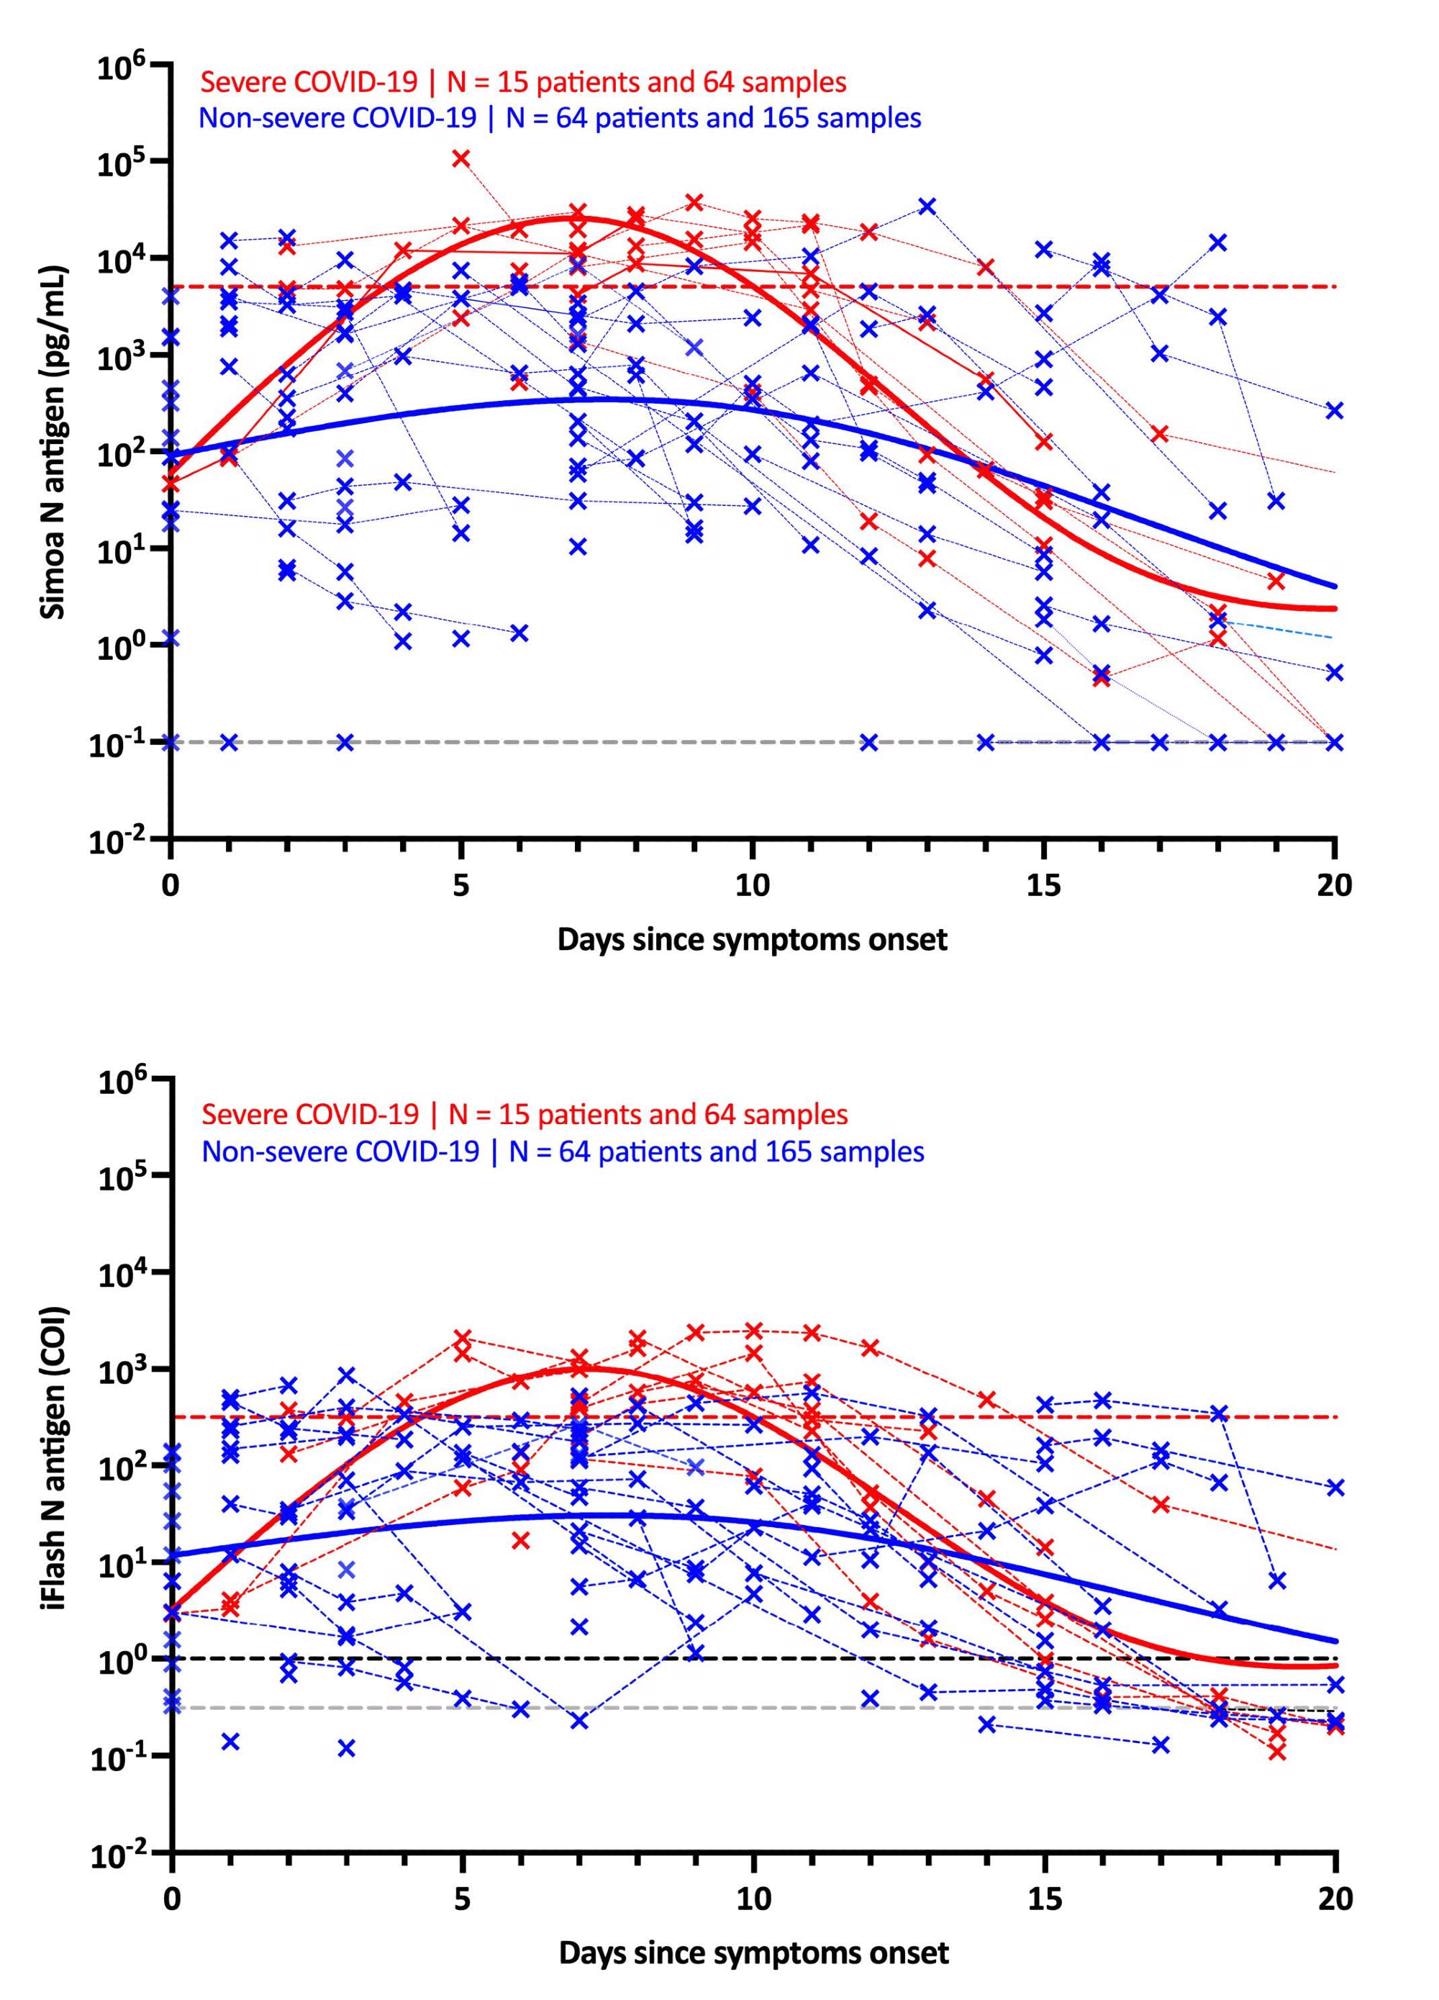
It was found that in individuals with severe symptoms, the maximal antigen reaction was detected on day-7 using both assays. Following that, a decline was recorded in the antigen reaction until day-20. The antigen-response in non-severe individuals corresponded to a plateau phase that gradually reduced with time. Using the Simoa assay, the difference in kinetics between severe and non-severe individuals was more discernible.
The use of these severity cut-offs on kinetic models determined the optimal time since symptom-onset in severe patients (i.e., 4 to 10 days). For both antigen assays, the clinical sensitivity was 100% and the clinical specificity was 92.3%.
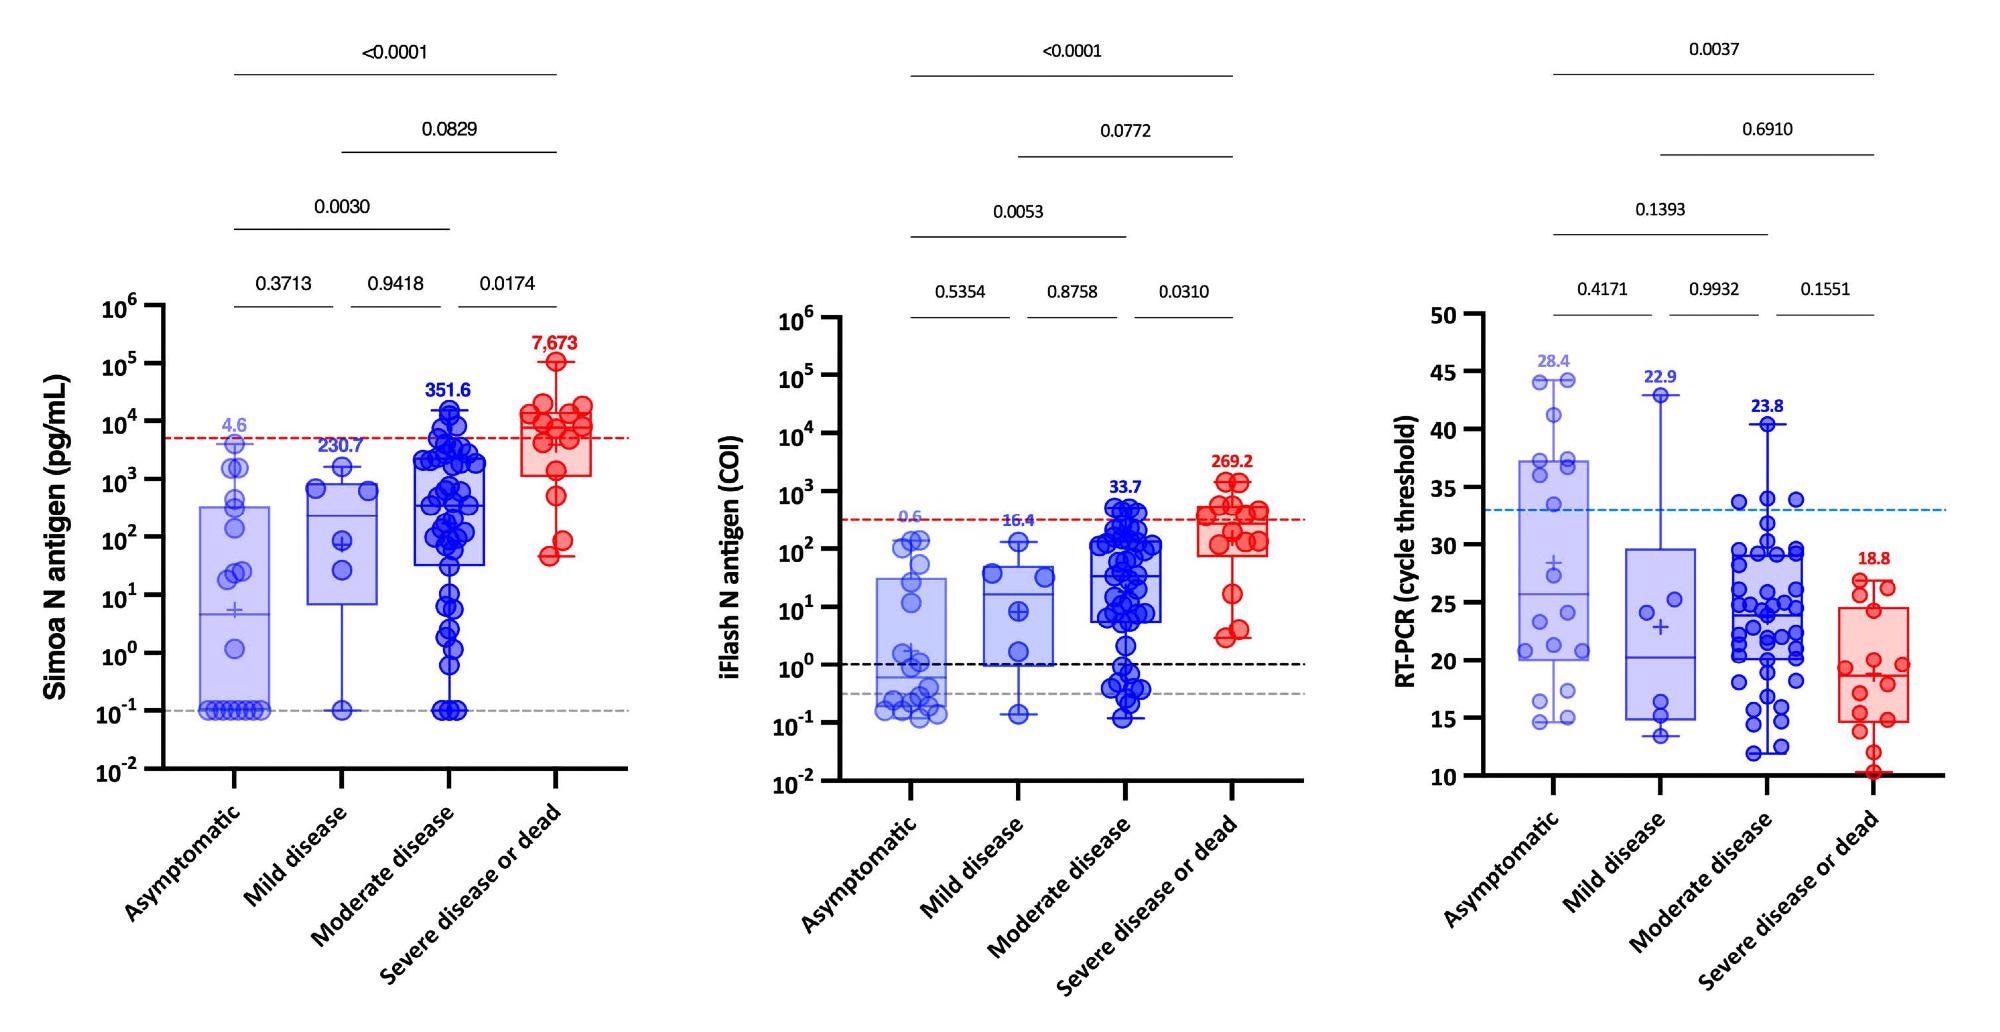
Further, when NP RT-PCR was used, the mean Ct value of asymptomatic patients was substantially greater than that of severe patients. At the same time, no significant difference was found between mild, moderate and severe patients. Serum-antigen assays revealed that severe patients had higher antigen levels. The distinction between severe and non-severe patients was most apparent between days 4 and 10.
On the Simoa and iFlash assays, cut-offs for identifying patients at higher risk for severe disease were predicted to be 5,043 pg/mL and 313.8 cut-off index (COI). The likelihood ratios for these cut-offs were 30.0 and 10.9, respectively, indicating their ability to differentiate severe from non-severe patients from day-2 to day-14.
Remarkably, patients with SARS-CoV-2 Spike IgG levels above the positive cut-off had statistically significant higher Ct values and decreased serum-antigen levels. Whereas the majority of patients (96.6%) with negative SARS-CoV-2 Spike IgG were positive for antigen in serum with both assays.
The analysis leads to the following conclusions.
- Sensitive N antigen detection in serum offers an important novel marker for COVID-19 diagnosis that is accessible in all clinical laboratories and just demands a blood draw.
- It enables prospective new improvements to create rapid antigen blood tests or integrated ELISA assays that detect both antigens and antibodies.
- Significantly, evaluating antigenemia in the first two weeks post symptom onset may aid in identifying people at risk of developing severe COVID-19.
- These assays are more convenient as testing procedures for patients and may eventually improve clinical triage in order to optimize intensive care utilization.
*Important Notice
medRxiv publishes preliminary scientific reports that are not peer-reviewed and, therefore, should not be regarded as conclusive, guide clinical practice/health-related behavior, or treated as established information.
- Favresse, J., Bayart, J., David, C., et al. (2021), “Serum SARS-CoV-2 Antigens for the Determination of COVID-19 Severity”, doi: 10.1101/2021.11.18.21266478, https://www.medrxiv.org/content/10.1101/2021.11.18.21266478v1
Posted in: Device / Technology News | Medical Research News | Disease/Infection News
Tags: Antibodies, Antibody, Antigen, Assay, Blood, Coronavirus, Coronavirus Disease COVID-19, CT, Diagnostic, Diagnostics, Efficacy, Enzyme, Genes, Immunoassays, Intensive Care, Lungs, Nasopharyngeal, Polymerase, Polymerase Chain Reaction, Protein, Research, Respiratory, Reverse Transcriptase, SARS, SARS-CoV-2, Severe Acute Respiratory, Severe Acute Respiratory Syndrome, Spike Protein, Syndrome, Triage

Written by
Nidhi Saha
I am a medical content writer and editor. My interests lie in public health awareness and medical communication. I have worked as a clinical dentist and as a consultant research writer in an Indian medical publishing house. It is my constant endeavor is to update knowledge on newer treatment modalities relating to various medical fields. I have also aided in proofreading and publication of manuscripts in accredited medical journals. I like to sketch, read and listen to music in my leisure time.
Source: Read Full Article