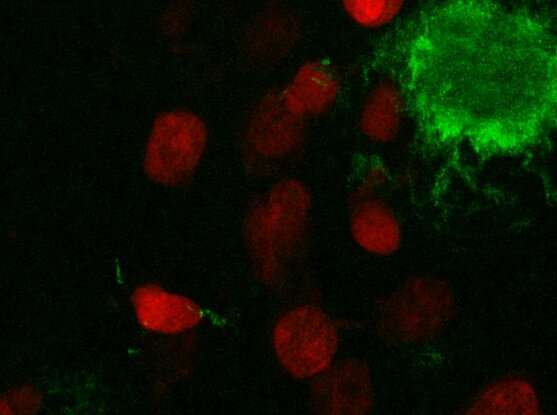
Many diseases affect how cells are spatially organized in tissues, such as in Alzheimer’s disease, where amyloid-β proteins clump together to form plaques in the brain. Studying how cells differ in various regions of tissue could help scientists better understand the key changes that lead to Alzheimer’s and other diseases. But integrating data on gene expression and cell structure and spatial location into the same analysis has proven challenging.
Now, researchers from the Broad Institute of MIT and Harvard and ETH Zürich in Switzerland have developed a computational framework for simultaneously analyzing gene expression, the structure of cell nuclei, and their position in space. STACI (Spatial Transcriptomics combined using Autoencoders with Chromatin Imaging) is the first method that combines these three kinds of data. The findings appeared recently in Nature Communications.
The team, led by Caroline Uhler, the study’s senior author and co-director of the Eric and Wendy Schmidt Center at the Broad, and Xinyi Zhang, first author on the study and a graduate student in Uhler’s lab, developed STACI and applied it to study a mouse model of Alzheimer’s disease.
STACI uses a kind of computational model called a neural network to analyze data generated by a technique called STARmap, which measures the expression of more than two thousand genes and maps their location in intact tissue. STARmap was developed by Xiao Wang, a core institute member at the Broad and co-author on the study.
The team used STACI to analyze brain tissue from the Alzheimer’s mouse model. By studying gene expression and the location of cells in the tissue, the scientists identified a part of the cortex in the mouse brain that was more likely to have significant plaque accumulations.
With the help of G. V. Shivashankar, a study author and professor of mechano-genomics at ETH Zürich, the team also found that they could predict plaque size—a marker of disease progression—by analyzing just one feature of cells near the plaques: the structure of chromatin, the complex of DNA and protein that makes up chromosomes. The results suggest that chromatin structure could be a marker of Alzheimer’s disease progression.
“We began by asking how we can integrate these different data modalities,” said Uhler, who is also a core institute member at Broad and professor in the Department of Electrical Engineering and Computer Science at MIT. “What’s really exciting is that now, with STACI, we can begin to ask biological questions to learn more about disease by taking all modalities into account simultaneously.”
Zhang, who is also a fellow at the Schmidt Center, says that STACI is a useful tool for researchers because chromatin imaging is routine in labs and cheaper than measuring the gene expression of cells directly. “This study may provide simple, low-cost avenues for studying which regions of the brain are more affected by disease and for tracking disease progression,” she said.
Cells in space
In previous work, Uhler and Shivashankar showed that they could use computational techniques to analyze single-cell RNA sequencing data along with chromatin images. They collaborated with Wang to incorporate the analysis of cell location data from STARmap and build STACI.
STACI relies on a neural network, which learns patterns from “training” data to predict characteristics of new data. To develop STACI, the researchers trained it to build a map, called a latent space, that groups together cells with similar locations, gene expression, or chromatin structure. They then used STACI to analyze images of chromatin from mouse brain tissue.
From this latent space, the scientists found that the size of plaque deposits is highly correlated with the ratio of heterochromatin to euchromatin, which indicates how densely packed the chromatin is. This relationship suggests DNA packing could be a marker of disease progression.
The team says the connection between chromatin density and plaques suggests new questions in Alzheimer’s research. They hope their findings will spur other groups to investigate the biological relationship between DNA packing and plaque build-up.
Branching out
Brain tissue samples can vary widely in how they are collected and prepared, but the scientists designed STACI to account for this variation. The technique could also be applicable to other spatial data types, such as from Slide-Seq—developed by Fei Chen, Evan Macosko and other colleagues at the Broad—as well as Visium and MERFISH.
Uhler adds that STACI could also help researchers learn more about other diseases, since many have important spatial features. She envisions using the framework to analyze the local microenvironment in cancer, fibrosis or scarring in the lungs or other tissues, as well as developmental processes. As scientists apply STACI to new problems, they’ll likely encounter new analytical challenges, but she thinks this is an opportunity to help the model expand.
“This work shows how biology can be a great inspiration for novel computational questions and developments,” Uhler said. “And that’s really exciting.”
More information:
Xinyi Zhang et al, Graph-based autoencoder integrates spatial transcriptomics with chromatin images and identifies joint biomarkers for Alzheimer’s disease, Nature Communications (2022). DOI: 10.1038/s41467-022-35233-1
Journal information:
Nature Communications
Source: Read Full Article
